Dec. 9, 2025
How Profit-Sharing Works in Alternative Investment Funds
Overview:
Profit distribution—or “waterfall”—defines fairness. Knowing where India stands globally helps investors understand the maturity of its fund structures.
Key Points:
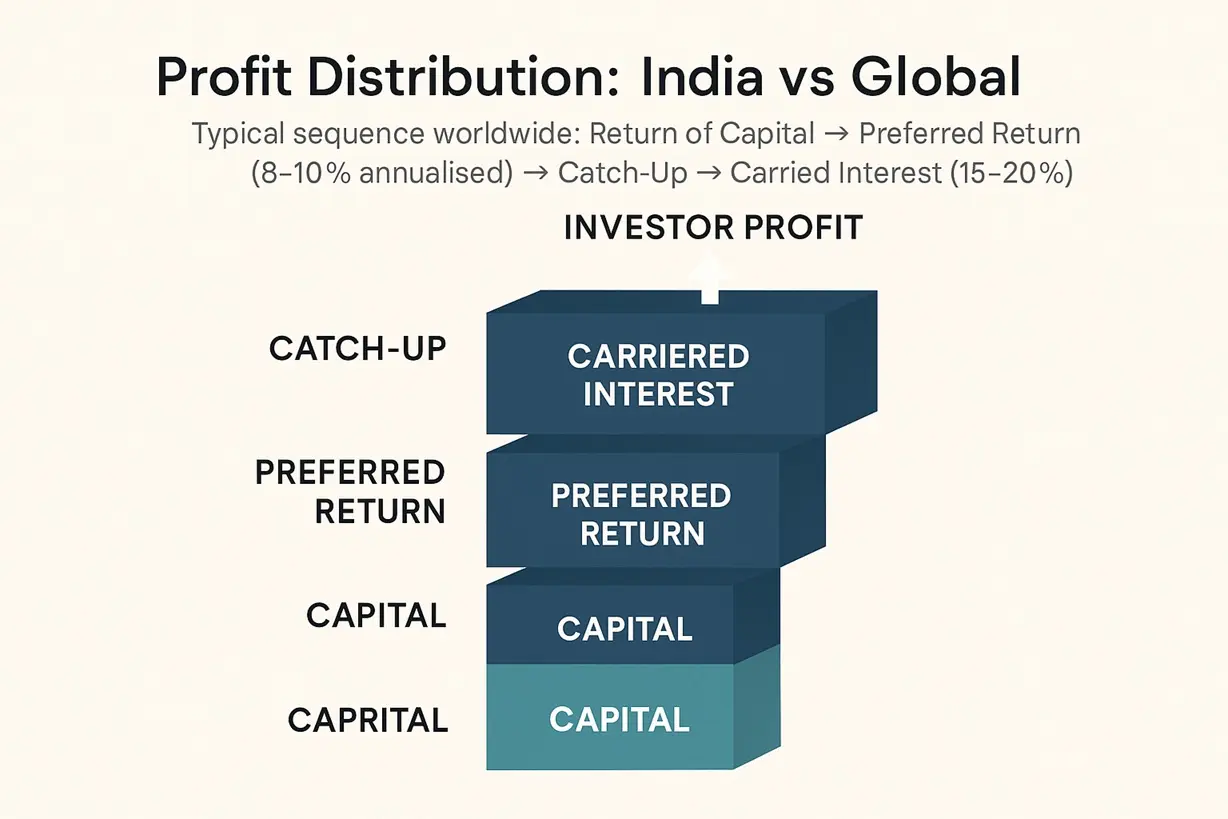
- Typical sequence worldwide: Return of Capital → Preferred Return (8 to 10 percent annualised) → Catch-Up → Carried Interest (15 to 20 percent).
- United States funds average a 20 percent performance carry; European vehicles range 15–18 percent; Indian funds average 16 percent.
- India’s Category II Alternative Investment Funds, worth ₹ 4.3 lakh crore (≈ USD 52 billion), mostly follow the “European” full-capital-return model—showing governance maturity.
- Global best practice—claw-back clauses and escrowed carry—now appear in 72 percent of Indian fund documents (SEBI data 2025).
- Example: A ₹ 100 crore fund yielding ₹ 30 crore profit returns ₹ 100 crore first, then pays ₹ 8 crore preferred return, splitting the ₹ 22 crore remainder between investors and manager.
- With this transparency, India’s internal-rate-of-return reporting variance fell below 3 percent vs global average 5 percent.
Truvest Capital Insight:
Clear waterfalls convert uncertainty into trust—India’s governance quality now mirrors developed-market norms.
Disclaimer: Educational content only. Not investment advice. Investments in Alternative Investment Funds or Portfolio Management Services are subject to market risk. Consult a SEBI-registered advisor before investing.